Electronic Temperature Monitoring and Control.
Background.
This is just an overview of the set up I currently have and it doesn't go into too much detail, more to give you a taster as to what is possible with an Arduino. micro controller and a few bits of electronics. It's one thing to play around with microcontrollers with some success on the dining room table , but its a different story to put together a system that's robust and reliable in a hostile environment. A whole new learning curve. The system for monitoring temperatures has evolved over a number of years, first with an analog system feeding an old industrial 8 bit logger. As the system grew, I needed more channels and better data storage capacity. A data logger was made in 2019 using an Arduino nano micro controller to save the data to an SD card. Data upload to a computer was done using a Bluetooth serial adapter. To replace the aging analog data capture module a whole new digital set up was constructed in 2024.
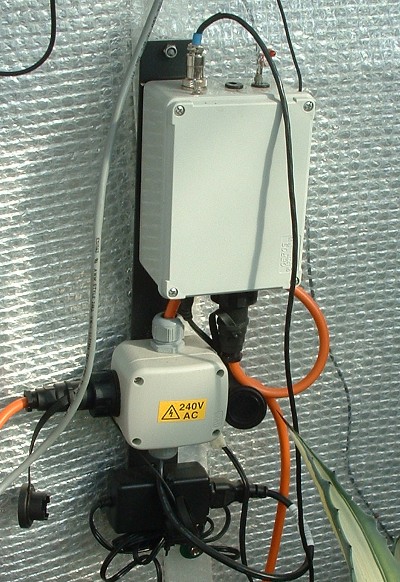
Data Capture and transmission.
Electronics is installed in the glasshouse using a die cast box that forms the interface to the individual sensors and an input from a current transformer to monitor power consumption. This uses an Arduino nano controller. The whole enclosure is covered with insulating foil to mitigate any temperature rises in direct sun. There are ferites on all cables that enter the enclosure.
Sensors and data transmission.
Up to 5 Dallas one wire temperature sensors
I2C Honywell Humidity Sensor
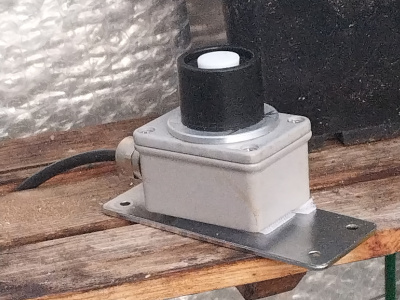
TSL2561 Light sensor for PAR
Energy Monitor.
Event logging from heating controller.
Data transmission using RS422 at 38400 baud in comma sep format with an 8 bit exclusive checksum.
Power supplied through a multicore cable together with serial comms.
Bluetooth serial interface for configuration and diagnostics using a BT serial phone app.
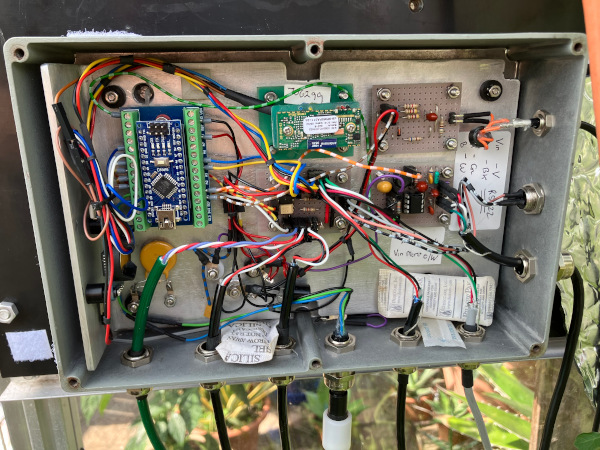 |
Sensor Data Acquisition Unit. |
| 
|
PAR Sensor. | Humidity Sensor. |
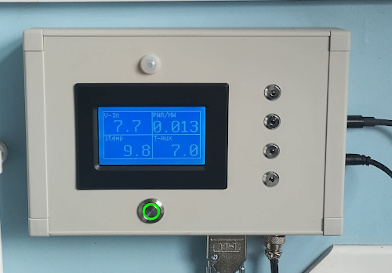
Indoor Display Unit.
The display unit is based on a 128 x 64 pixel lcd display. The pages of the screen are cycled trough by pressing the button.
Page 1 Inside and outside temperature, Humidity and PAR.
Page 2 Vin - power supply voltage, Power consumption in kW, Internal case temperature, AUX temperature sensor.
Page 3 Date and time
A PIR sensor turns on the LCD backlight if any movement is detected and the display defaults to page 1 upon detection.
Front panel LEDs indicate heater or fan activity, warning of tempertures approaching temperatures of interest and a data receiving led. There is also an internal sounder that alarms outside the range of 2 - 45 deg. C.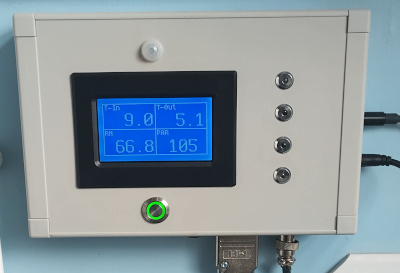
| 
|
Indoor Display Page 1. | Indoor Display Page 2. |
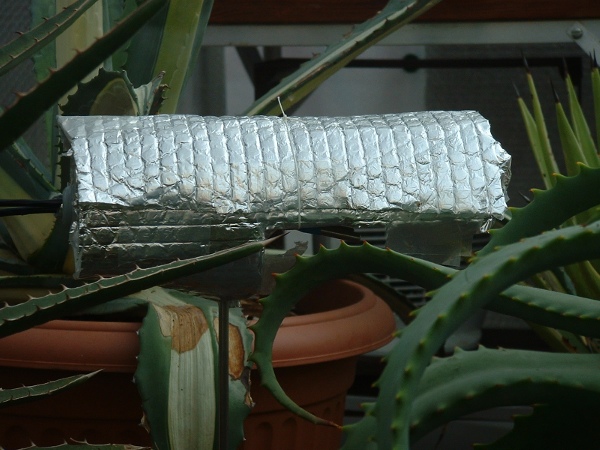
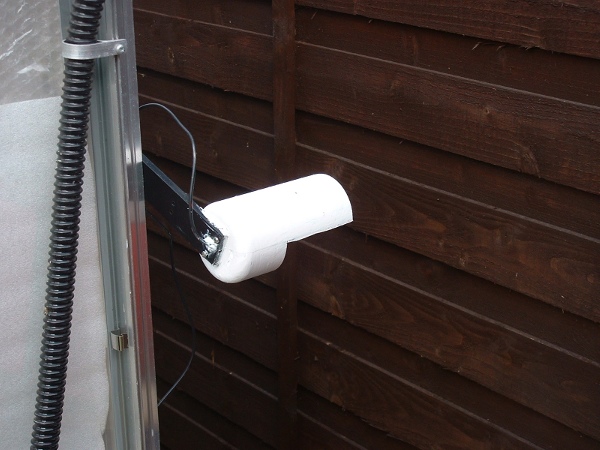
Thermal shielding.
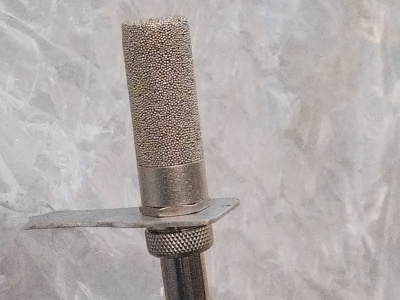
To guard against incorrect readings because of heating by direct sunlight, the outside temperature sensor is shielded from direct sunlight by a curved piece of plastic painted white. The shield was constructed by cutting away the top and one side from a plastic bottle. The inside temperature sensor is of similar construction with the addition of some reflective thermal insulation.
| 
|
Inside temp sensor. | Outside temp sensor |
Temperature Controller construction.
The controller was constructed as an experiment in response to the poor performance of bimetallic thermostats found in commercial greenhouse heaters at the lower end of the market. It was made from salvaged electronic components from a UPS and housed in a waterproof plastic enclosure. The sensor circuit is based on a ntc thermistor and two op amp comparators.
The first comparator is set up to control a heater and the second comparator is set up to control a fan for forced air cooling in the summer months. Each comparator drives a relay capable of switching mains voltages at currents up to 10A. Getting the hysteresis right involved a bit of trial and error because in addition the the theoretical value from the circuit design there was the thermal mass of the sensor to consider.
There are event outputs for interfacing to the data acquisition unit , there are also control voltage outputs for driving solid state relays. The temperature sensor for the controller is independent of the temperature display and monitoring circuits. The added advantage of using this set up is that I can use just about any type of heater and because there is no watering of plants done between November and March when the heater is in place, a domestic fan heater can be used with the thermostat disabled or set on its maximum setting. In any case I'm not prepared to risk having a micro controller or some other digital device freezing up and either disabling the heater or leaving it permanently on.
The schematic for the controller can be found in the Temperature Controller Schematic Page.
 |
Electronic Temperature Controller. |
Data Processing.
The uploaded data from the data logger is first imported into an Open Office spreadsheet to weed out any invalid data where the checksum was invalid. Do get the odd one occasionally. Data is then saved in a comma sep file for each month.
Each file is then plotted using gnuplot.
Recent Data Example.
The link below is an example of the png graphics file output from gnuplot.
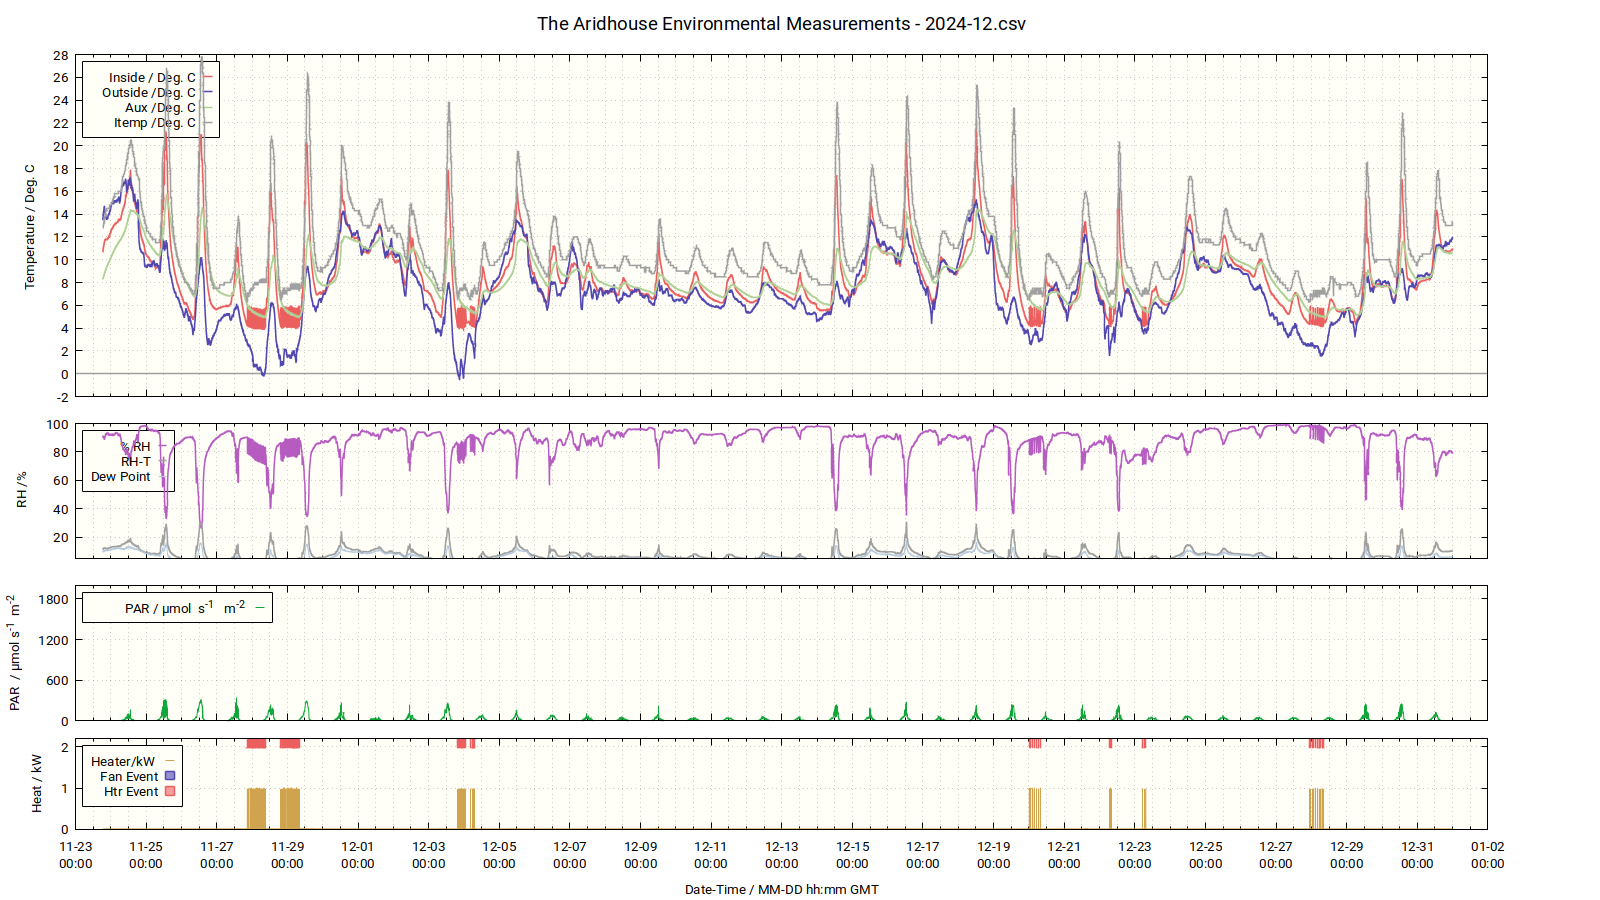